Project
Manufacturing Operations Dashboard
Purpose
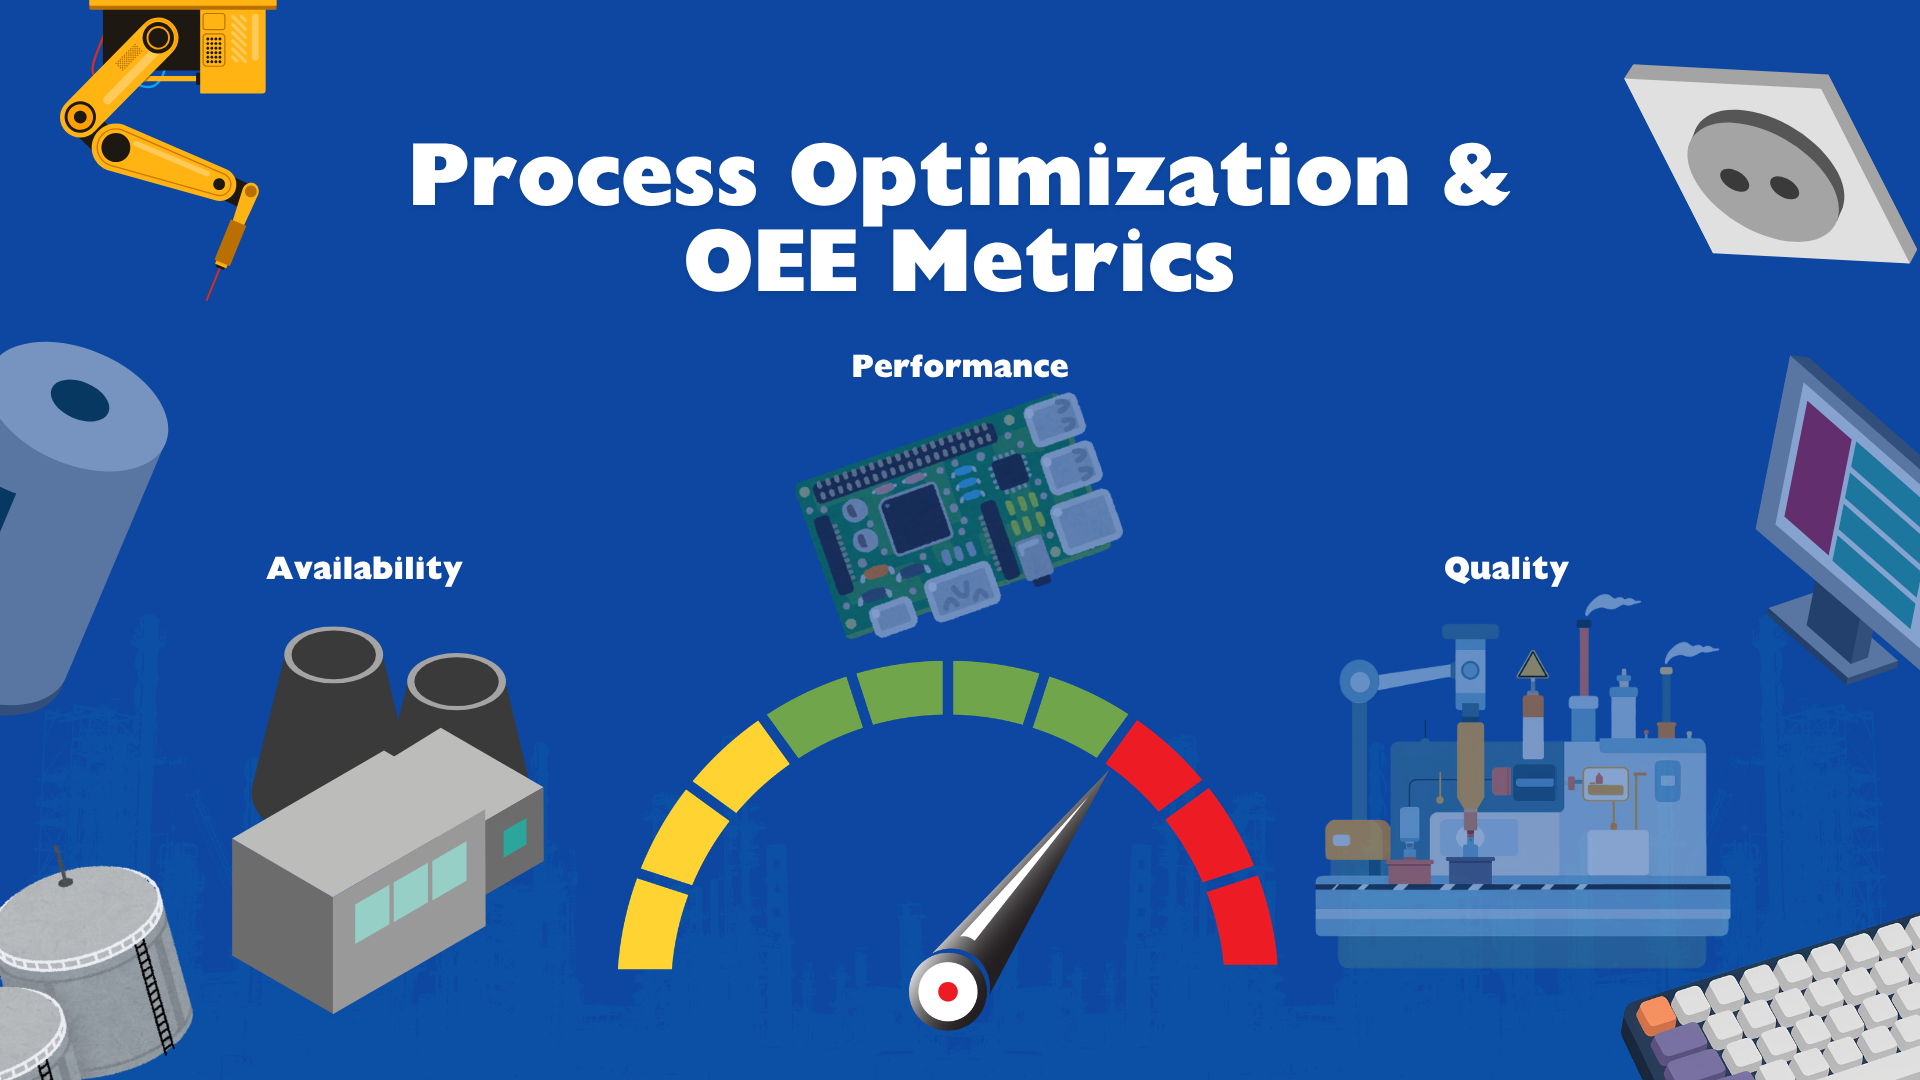
This design study explores how production information could be organised around availability, performance and quality, the three factors used in Overall Equipment Effectiveness (OEE).
Scope
The proposed interface would bring together production counts, planned production time, stop durations and quality losses. The aim is to help a user understand the inputs behind an indicator and identify which loss to investigate next.
Design priorities
- Show the reporting period and the definitions behind each metric.
- Keep source data and calculated indicators distinguishable.
- Make missing or stale data visible.
- Allow the user to move from a summary to the events behind it.
Current state
This is a concept and requirements study, illustrated by an overview graphic. It does not demonstrate a live connection to production equipment, a predictive-maintenance model or an AI analytics service.
A working prototype and a reproducible sample dataset would be needed to evaluate the interface and calculations. No production results are claimed.